


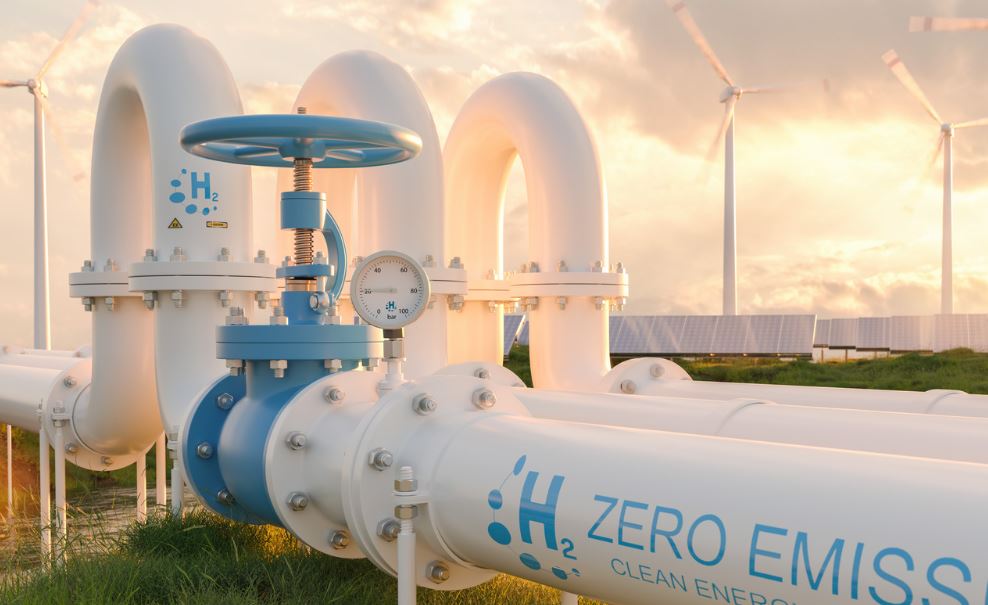


When energy infrastructure operators evaluate blending hydrogen into natural gas transmission networks, the safety calculus appears straightforward at first glance. However, quantitative risk assessments reveal a surprising physical reality: overall pipeline risk does not scale linearly with hydrogen concentration. In a high-pressure 10-kilometer transmission pipeline operating at 84 bar and 50 °C, the maximum individual risk does not occur with pure natural gas or pure hydrogen.
Lower Mass Flow Rates Do Not Equal Lower Risk
When a pipeline breach occurs, fluid density determines release dynamics. Substituting natural gas with lighter hydrogen molecules lowers mixture density, reducing mass discharge rates through equivalent orifice sizes.
While lower mass flow rates accelerate depressurization and shorten total release duration, relying solely on mass release figures creates a false sense of security. The distinct combustion kinetics of hydrogen fundamentally reshape hazard zones downwind.
| Scenario / Metric | Pure Natural Gas | 10% Hydrogen | 20% Hydrogen | 30% Hydrogen | 50% Hydrogen | 100% Hydrogen |
| Max Flow: 6-inch Leak (kg/s) | 164 | 155 | 147 | 138 | 119 | 55.1 |
| Max Flow: Rupture (kg/s) | 4,510 | 4,280 | 4,050 | 3,800 | 3,280 | 1,520 |
| Jet Fire Distance: Rupture @ 1.6 kW/m² (m) | 649 | 627 | 606 | 586 | 546 | 167 |
| Jet Fire Distance: Rupture @ 4.0 kW/m² (m) | 430 | 416 | 402 | 387 | 356 | 0 |
| VCE Distance: 6-inch Leak @ 10 mbar (m) | 186 | 213 | 249 | 284 | 339 | 632 |
| VCE Distance: Rupture @ 10 mbar (m) | 1,360 | 1,515 | 1,677 | 1,847 | 2,130 | 2,824 |
| Peak Individual Risk ($\times 10^{-6} \text{ yr}^{-1}$) | 1.35 | 1.94 | 2.03 | 2.03 | 2.33 | 1.63 |
Shorter Flame Footprints, Expanding Blast Hazards
An immediate ignition event produces a thermal jet fire, whereas delayed ignition allows gas dispersion prior to ignition, triggering a flash fire or vapor cloud explosion. Hydrogen blending creates opposing effects across these two failure pathways.
Jet fire thermal radiation zones contract as hydrogen content increases. Although hydrogen exhibits a higher adiabatic flame temperature, its flames produce virtually no soot. Because soot is the primary vehicle for radiative heat transfer in hydrocarbon combustion, hydrogen flames exhibit low emissivity.
Delayed ignition scenarios present the opposite behavior. Hydrogen features a wide flammability range of 4 to 75 percent, a low minimum ignition energy of 0.02 mJ, and rapid flame propagation speeds. These properties drive severe blast overpressure generation during unconfined or congested vapor cloud explosions.
Why Individual Risk Peaks at Mid-Level Blends
Combining event probabilities, directional weather dispersion, and consequence metrics explains why individual risk exhibits a non-monotonic curve.
At a 50 percent hydrogen blend, the gas mixture retains enough radiative jet fire potential while gaining significant vapor cloud explosion capability. Breakdown of risk drivers at specific receptor locations reveals that jet fires account for 71 percent of individual risk in pure natural gas but drop to 45 percent in pure hydrogen. Conversely, flash fires and vapor cloud explosions increase their share of total individual risk from 29 percent in natural gas to 55 percent in pure hydrogen.
Spatial transects show distinct risk geometry across blends. A 50 percent blend creates a sharp risk concentration along the pipeline centerline that decays rapidly with distance. Pure hydrogen exhibits a lower peak at the pipeline centerline but maintains elevated risk across a broader spatial perimeter due to far-reaching blast waves from full-bore ruptures.
Societal Consequences and Integrity Management
Societal risk calculations via cumulative frequency-number curves indicate that all blending ratios satisfy standard UK Health and Safety Executive tolerability limits ($2 \times 10^{-4} \text{ yr}^{-1}$ for 50 fatalities). However, pure hydrogen expands the high-consequence tail of the distribution.
For blends between 0 and 50 percent hydrogen, the maximum Guide Ratio occurs at 15 to 24 potential fatalities. For pure hydrogen, the maximum Guide Ratio shifts to 47 fatalities. Pure hydrogen is also the only scenario yielding a non-zero cumulative frequency at 50 fatalities ($4.3 \times 10^{-6} \text{ yr}^{-1}$), with full-bore rupture flash fires driving 93 percent of that frequency.
These quantitative realities carry critical implications for infrastructure repurposing. Standard risk models frequently assume historical natural gas failure frequencies across all blending ratios. This assumption omits long-term hydrogen degradation mechanisms such as embrittlement, fatigue crack growth, and fracture toughness reduction in legacy steel networks. If material degradation increases failure frequencies over time, actual operational risk will exceed current predictions.
Mitigation strategies must adjust focus from thermal radiation buffer zones to blast overpressure containment. Effective risk management requires deploying fast-acting line-break isolation valves, installing advanced gas detection systems, clearing rights-of-way to prevent flame acceleration in congested structures, and adjusting separation distances based on overpressure footprints.
Add EnergyNews.biz as a preferred source on Google


