




Renewables M&A reached about $80 billion in the first nine months of 2026, up around 15% year on year in reported value, according to a release published on 29 October by the market intelligence firm Enerdatics. The firm says transaction activity rose about 7%, trailing the growth in value. The most striking detail is where storage now sits: in North America it appears in almost every platform deal the firm tracked.
Storage moves into the deal structure
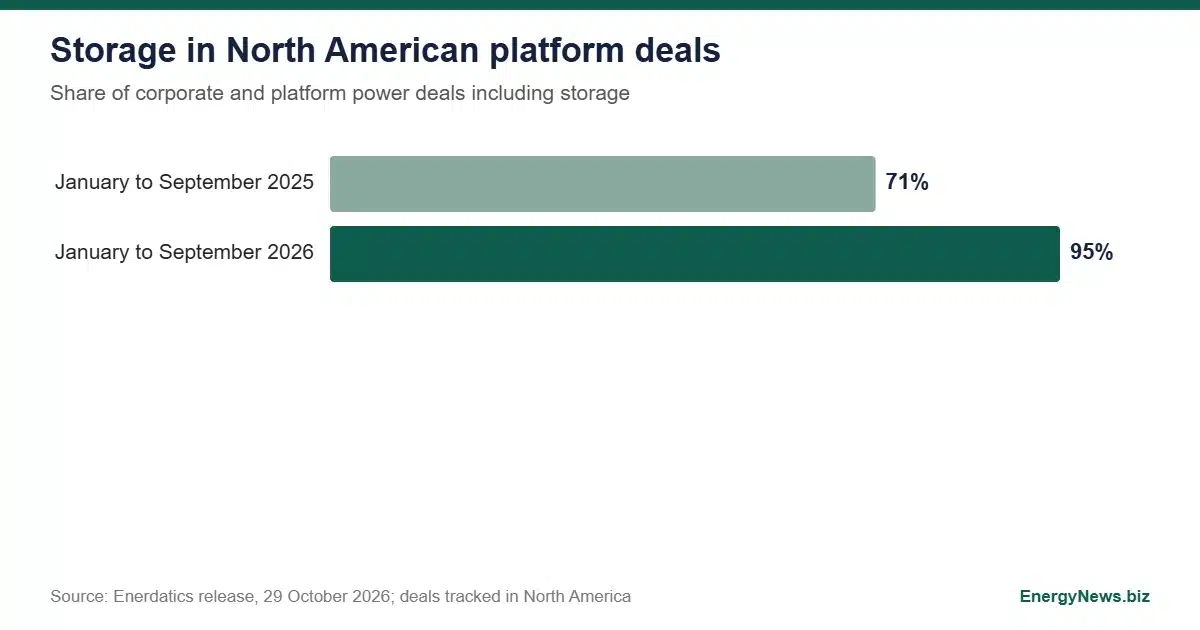
The release says storage featured in 95% of corporate and platform power deals tracked in North America, up from 71% a year earlier. It also reports that battery energy storage deal activity in the region rose 75% and solar plus storage activity rose 65%. The release does not say whether activity is measured by deal count or by value, and it does not define the base for the 95% figure beyond deals tracked.
The regional picture
The figures below are as reported by the firm. Reported deal values include disclosed values only, so undisclosed transactions are outside the totals.
| Region | Reported figure | Detail given |
|---|---|---|
| Global | About $80 billion, up about 15% | January to September 2026 against the same period of 2025 |
| North America | About $61 billion in deal value | Private equity behind around half of acquisitions |
| Europe | Battery storage activity nearly doubled to 109 deals | UK and Germany lead by transacted capacity; solar activity down about 20% |
| Asia Pacific | Activity up about 20% | Led by India, with Australian wind and storage also contributing |
| Latin America | Activity down about 55% | Curtailment in Brazil and Chile made buyers more selective |
A simple calculation from the stated figures shows that North America accounts for about 76% of the reported global value, $61 billion of $80 billion. The headline growth is therefore largely a North American story, with Europe and Asia Pacific growing in activity rather than in disclosed value.
Read the numbers with care
The release is a paid distribution, and the platform that carried it states that the content is the author’s responsibility. It names no database or method beyond the disclosed values rule. Count versus value is not stated for the 7%, 75%, 20% and 55% figures, and the European total of 109 deals has no prior year count to check against. The release also says contingent payments featured in 16 of 24 European development stage deals with disclosed terms, a share of 67% drawn from a small sample.
For capacity data to set beside the deal figures, the International Renewable Energy Agency publishes annual statistics, while a related grid equipment deal is covered in a report on the Trench acquisition.
The limits matter because renewables M&A statistics are often built from public announcements, and announcements skew toward larger and listed transactions. These limits do not make the direction wrong, but they argue for treating individual percentages as indications. Independent deal databases and regulators’ filings would be the way to confirm them.
What the data suggests for renewables M&A
If the North American share holds up, storage has become a default feature of how platforms are bought and sold, not an add on. Buyers pricing a platform now price a storage pipeline with it. The pace of renewables M&A in a region also tracks how comfortable buyers are with the revenue risk of the assets, and the Latin American drop points the other way: where curtailment erodes the value of generation, buyers step back, and the release expects storage contracts to support deals there, starting with Brazil’s first battery storage auctions in December 2026.
For renewables M&A as a whole, the split between a busy North America and a cautious Latin America is the pattern to follow into the fourth quarter.
Add EnergyNews.biz as a preferred source on Google


