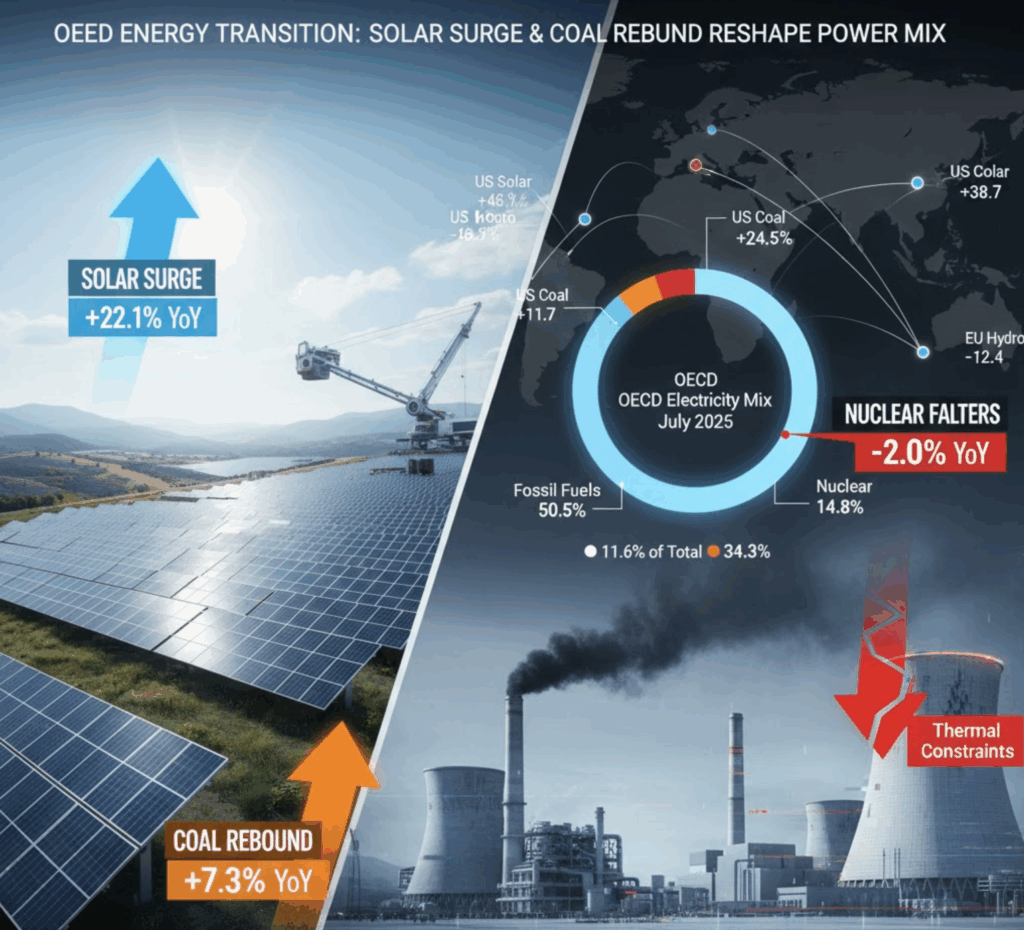
OECD electricity generation reached 1,027.6 TWh in July 2025, marking a modest 2.3% year-on-year increase, yet beneath this incremental growth lies a sharply bifurcated energy transition—one where renewable capacity expansion accelerates while structural vulnerabilities in traditional power systems emerge.
The headline figures mask deeper market dynamics. Fossil fuels retained their dominant position with 518.8 TWh (50.5% of total generation), though this aggregated figure obscures divergent trajectories within the sector itself. Natural gas generation contracted by 2.0% year-on-year to 323.6 TWh (31.5% of the mix), signaling potential market saturation or dispatch constraints in conventional gas infrastructure. Conversely, coal-fired generation surged 7.3% year-on-year, adding 12.0 TWh to reach 177.9 TWh (17.3% of generation)—a reversal that contradicts the widely anticipated decline in thermal coal power.
This coal resurgence warrants scrutiny. The United States drove the plurality of growth, with coal generation climbing 11.7% year-on-year and contributing 8.7 TWh of the sector-wide increase. Korea accounted for an additional 4.0 TWh through a 24.5% year-on-year expansion. The drivers merit consideration: seasonal demand patterns, supply constraints in other fuel sources, and potential economic rebound in industrial-heavy jurisdictions likely intersected to create temporary coal demand. Whether this represents a structural reversal or cyclical phenomenon remains uncertain, particularly given concurrent renewable deployments.
Renewable electricity generation emerged as the growth engine, advancing 6.1% year-on-year to 352.2 TWh (34.3% of generation). Within this segment, solar power demonstrated exceptional momentum, expanding 22.1% year-on-year with an absolute increase of 21.6 TWh—the largest gain across all generation technologies. Total solar output reached 119.2 TWh, now representing 11.6% of OECD generation, a threshold that underscores solar’s transition from supplementary to material infrastructure.
Geographic disaggregation reveals asymmetric deployment patterns. The OECD Americas recorded solar growth of 34.3% year-on-year, reaching 48.3 TWh, with the United States alone accounting for 12.0 TWh (38.7% year-on-year growth). This concentration reflects the scale advantages of the U.S. market and recent policy incentives, but also signals potential saturation in existing high-irradiance regions. OECD Europe’s solar generation increased 12.9% year-on-year to 52.5 TWh, a more modest pace than the Americas despite Europe’s higher installed capacity, suggesting efficiency plateaus or grid integration constraints. Türkiye emerged as a notable standout, achieving 46.3% year-on-year growth (+1.7 TWh), indicating accelerating deployment in emerging OECD markets.
Wind power advanced 8.4% year-on-year, adding 6.2 TWh to reach 79.4 TWh (7.7% of generation). While this represents continued expansion, the growth rate—approximately one-third that of solar—suggests wind capacity additions are moderating relative to solar’s deployment trajectory, either through market preference, technical limitations in available sites, or regulatory constraints in established markets.
Hydropower generation declined 5.9% year-on-year, contracting by 7.8 TWh to 123.7 TWh (12.0% of generation). OECD Europe accounted for the substantial majority of this decline, recording a 12.4% year-on-year decrease totaling 6.8 TWh. This contraction reflects extended drought conditions and precipitation deficits across Europe, a pattern consistent with broader climate observations. The decline underscore hydropower’s vulnerability to hydrological variability—a factor that complicates renewable energy reliability assessments and highlights the critical importance of geographical diversification in renewable portfolios.
Nuclear power generation decreased 2.0% year-on-year, declining 3.1 TWh to 152.2 TWh (14.8% of generation). Reductions manifested across regional portfolios: OECD Europe contracted 4.4% year-on-year (-2.4 TWh), and OECD Asia Oceania fell 5.2% (-1.2 TWh), while the OECD Americas held flat. Switzerland’s experience provides instructive context: nuclear output plummeted 46.8% year-on-year due to thermal constraints imposed by a severe heatwave that pushed cooling-water temperatures beyond regulatory safety thresholds. This episode demonstrates an emergent vulnerability in thermal generation systems—both conventional and nuclear—to climate-induced cooling-water limitations. Despite the sharp decline, Switzerland maintained nuclear at 18.1% of total generation, highlighting the fuel’s persistent structural importance in decarbonized energy systems even under stress conditions.
The July 2025 snapshot reveals an electricity system undergoing transition within structural constraints. Renewables, particularly solar, are scaling rapidly and already represent one-third of generation capacity. Yet coal’s temporary rebound and nuclear’s persistent challenges indicate that decarbonization pathways remain contested. The interplay between dispatch flexibility (advantaging solar’s marginal costs), baseload requirements, and climate vulnerabilities (evident in both hydropower drought and nuclear thermal constraints) will likely define the OECD’s energy infrastructure evolution through the next decade. Supply-side dynamics alone will increasingly fail to meet decarbonization targets absent corresponding demand-side transformation and grid architecture modernization.
Stay updated on the latest in energy! Follow us on LinkedIn, Facebook, and X for real-time news and insights. Don’t miss out on exclusive interviews and webinars—subscribe to our YouTube channel today! Join our community and be part of the conversation shaping the future of energy.


