


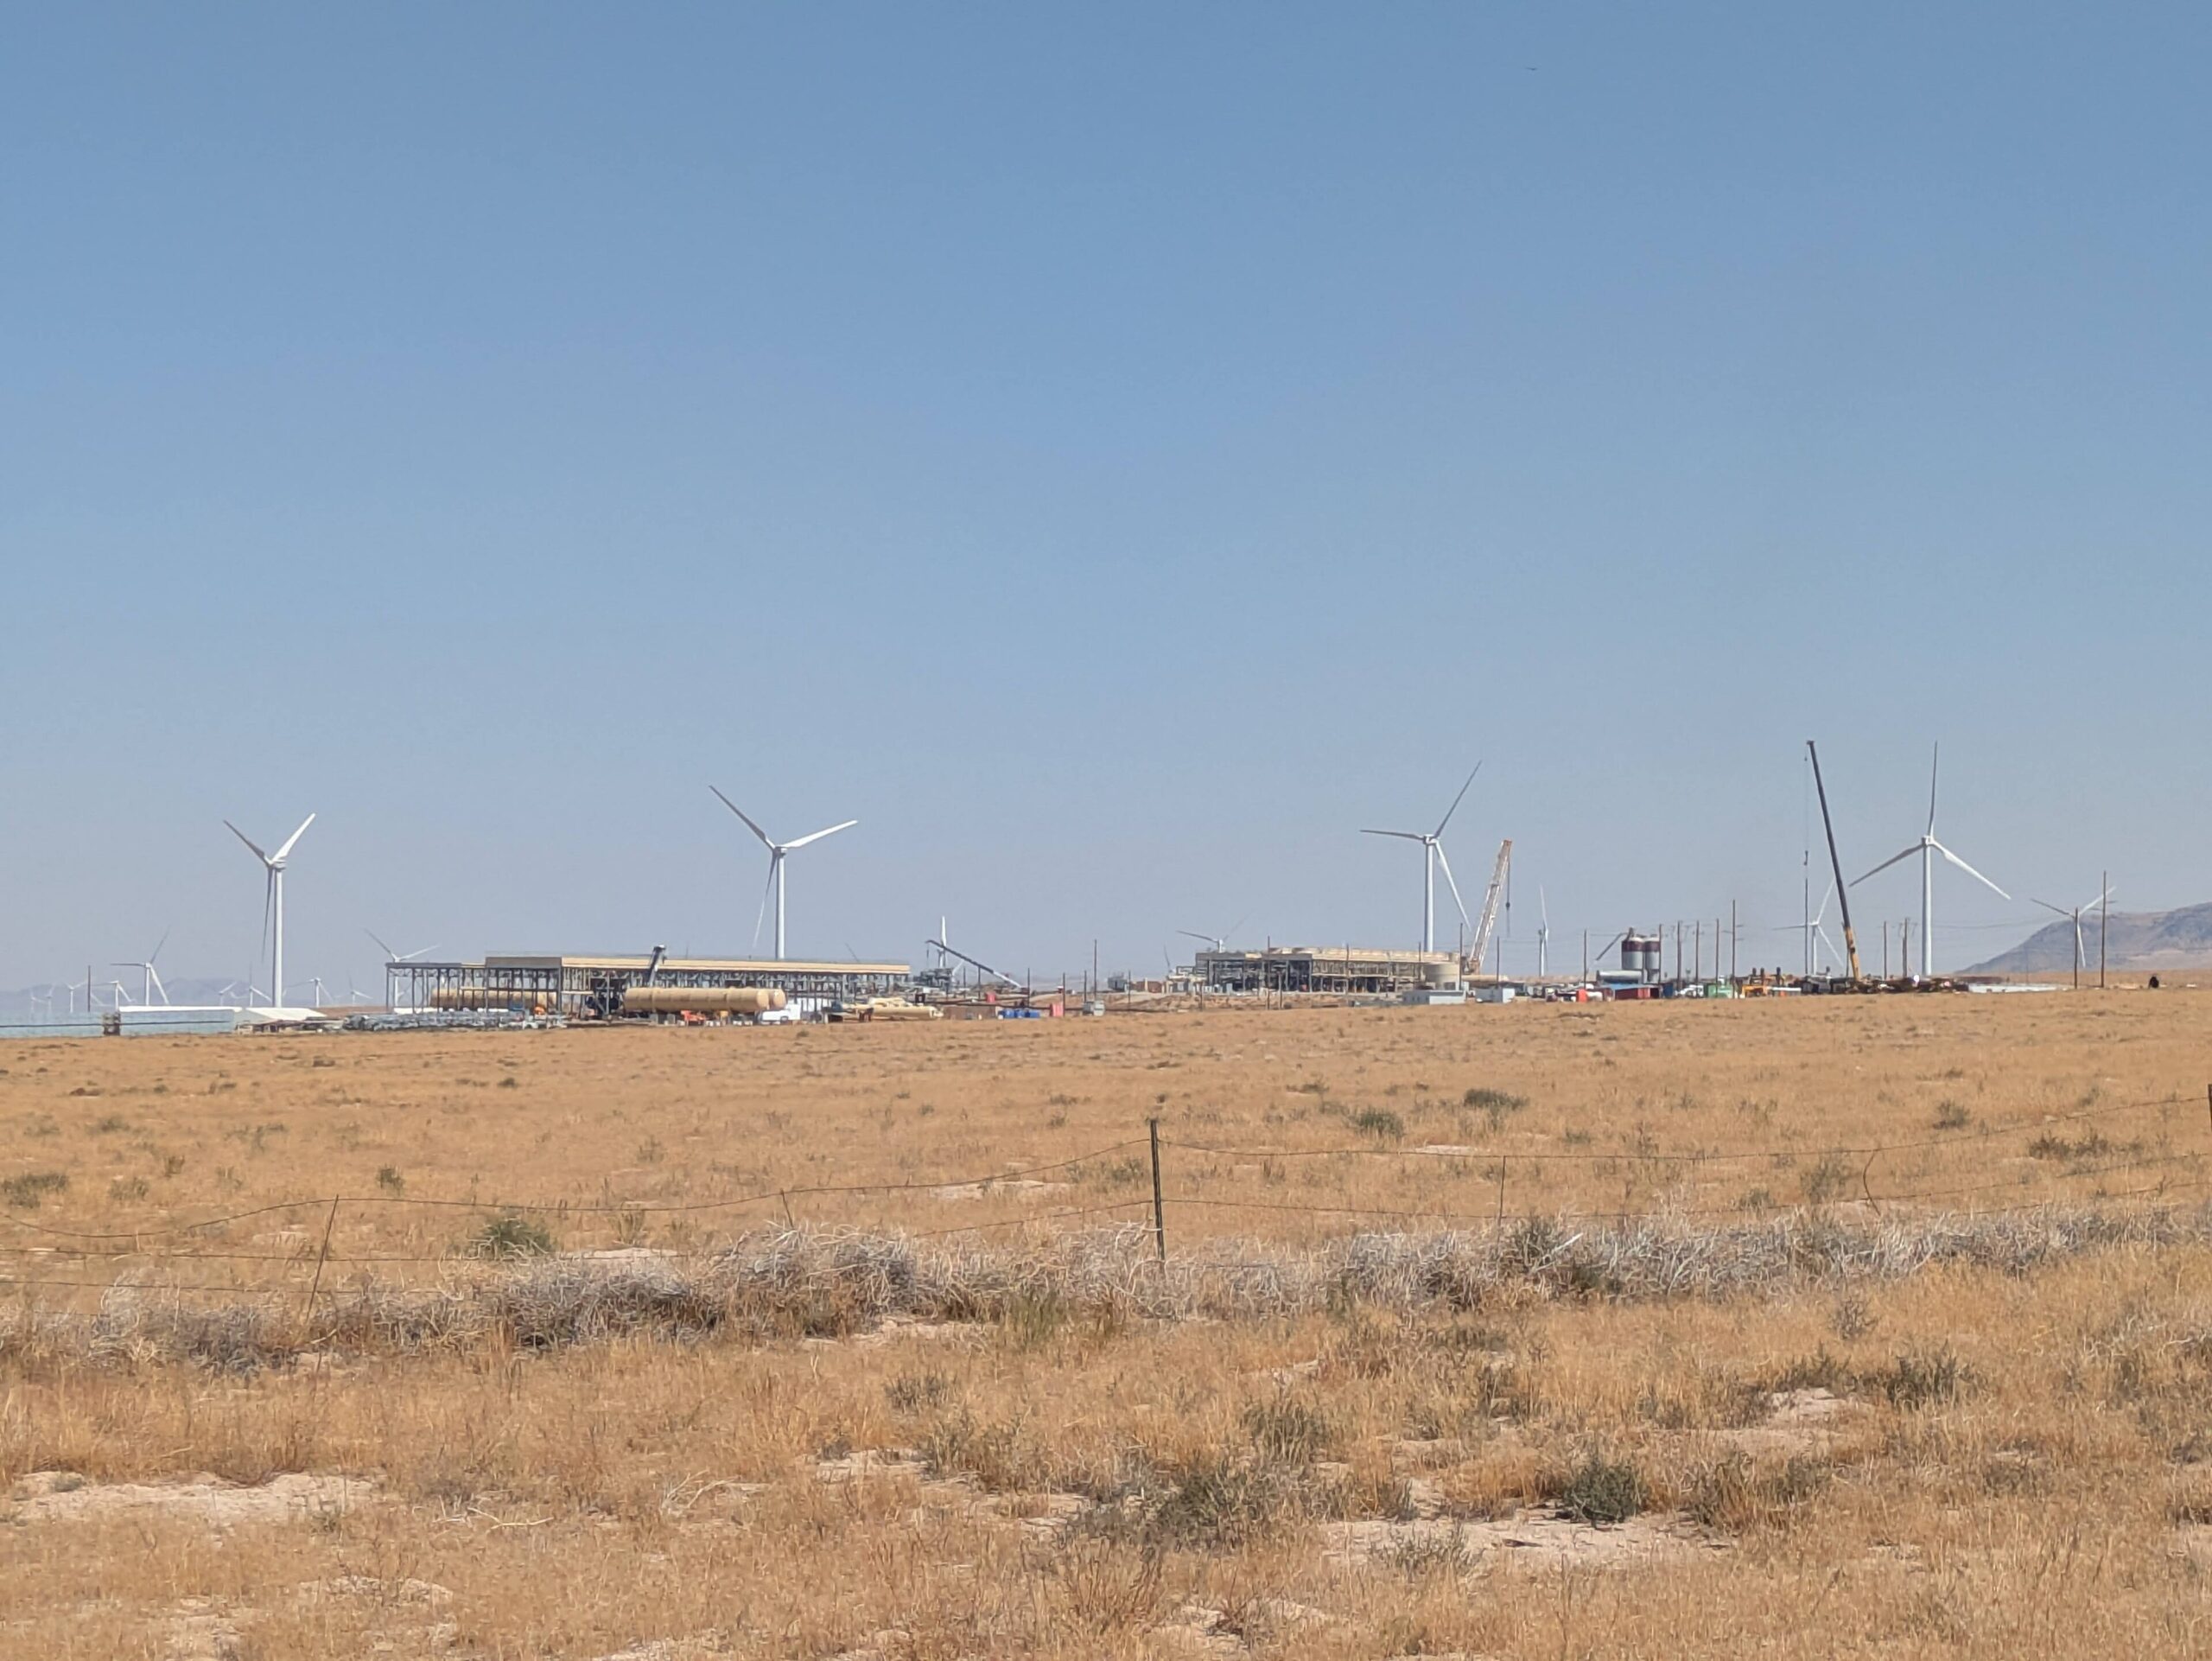


Fervo Energy says the first 33 MW GeoBlock at Cape Station, Utah, reached commercial operation on 30 September 2026, six days after grid synchronisation. The 33 MW is net output under its offtake contract. The announcement omits the two numbers that set the economics: how many wells feed the block, and what each producer flows. Rebuilt from regulatory and laboratory records, 33 MW net implies roughly five producers at about 100 kg/s. A 50 MW block on the planned 8 to 10 wells closes only at the top of published flow and temperature ranges.
What the company states and omits
The company states a 23 month build to commissioning for the first block, an 18 month target for later blocks, about 100 MW across three Phase I blocks, the remaining two by 1 January 2027, and 400 MW of Phase II in 2028. It gives no well count, flow rate or gross output. ENB’s earlier piece on Cape Station’s first power being 33 megawatts, not the 100 it is measured against covers the capacity framing.
The company’s S-1 registration statement, filed with the US Securities and Exchange Commission in April 2026, adds a little. It reports more than 25 wells drilled across 500 MW under construction, a plan to drill about 8 to 10 wells per standardised 50 MW GeoBlock, Phase I wells of about 9,000 ft true vertical depth, 14,000 ft measured depth and 5,000 ft laterals, and a first Cape project cost of about $7,000/kW. It does not state flow per producer.
Published flow rates per well
The only flow figures in the public technical record come from tests, not from the operating block. A 2025 Stanford geothermal workshop paper cites circulation rates of 93 to 121 kg/s at Project Cape, a Fervo test site, and reports 28 kg/s sustained over 30 days at the Utah FORGE site, where only 1,000 ft of lateral had been stimulated. A 2024 workshop paper on the Project Cape drilling programme reports an average lateral temperature of about 200 C, and 444 F (229 C) at 9,647 ft in its vertical observation well.
Net MWe per producing well
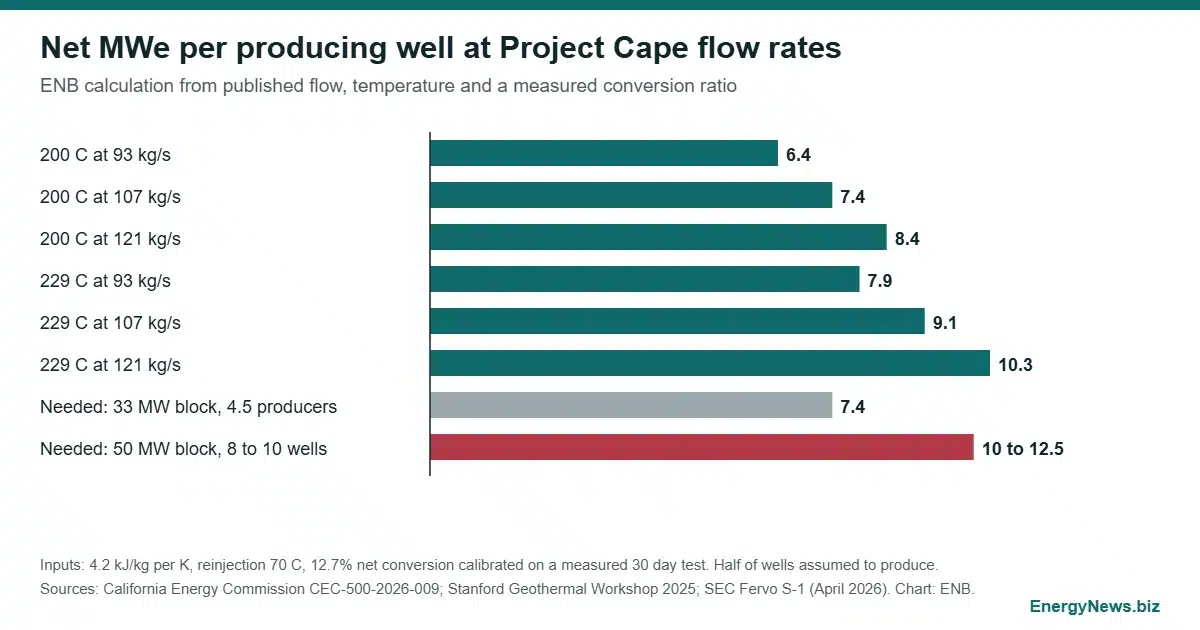
To convert flow to power, ENB calibrated against a measured case. A 30 day closed-loop test at The Geysers, published by the California Energy Commission in April 2026, sustained 7.4 MWth at 20.4 kg/s and 155 C outlet, with 0.94 MWe net. That is 12.7% net conversion. Hotter fluid should convert better, so the figure is conservative here.
Inputs: specific heat 4.2 kJ/kg per K, reinjection at 70 C (an ENB assumption), conversion 12.7%.
| Production temperature | Heat per kg/s | Net MWe at 93 kg/s | Net MWe at 107 kg/s | Net MWe at 121 kg/s |
|---|---|---|---|---|
| 200 C | 0.546 MWth | 6.4 | 7.4 | 8.4 |
| 229 C | 0.668 MWth | 7.9 | 9.1 | 10.3 |
Does 33 MW or 50 MW close on 8 to 10 wells
At 7.4 MWe per producer, a 33 MW block needs about 4.5 producers. Paired one to one with injectors, that is about nine wells, inside the S-1 range. The Phase I block is therefore plausible on published flows, though the filing’s well count is stated for the 50 MW design, not the 33 MW units.
The 50 MW design is harder. If half of 8 to 10 wells produce, each producer must deliver 10 to 12.5 MWe. Only the hottest, highest-flow corner of the table reaches 10.3 MWe, and only with five producers. Otherwise the design needs more than 121 kg/s per producer, hotter brine, better conversion, or more producers than injectors. The sections of the S-1 reviewed do not say whether the 50 MW is net or gross, or how wells split between producers and injectors.
Drilling cost share of a GeoBlock
The National Renewable Energy Laboratory reported at the same workshop that 14 horizontal Cape wells drilled in 2023 and 2024 cost $346 to $994 per ft, with average rate of penetration of 70 ft/h and bit life of 34 hours. At 14,000 ft measured depth that is $4.8 million to $13.9 million per well. For 8 to 10 wells the range is $39 million to $139 million.
Against $7,000/kW on 33 MW, or $231 million, drilling would take 17% to 60% of block capital. The spread is the finding: cost per foot, not headline megawatts, decides the margin. The company states that per-foot costs fell about 70% from 2022 to 2025, so the 2023 and 2024 sample may overstate current cost. The $7,000/kW basis, net or gross, is not defined in the filing.
What to watch after commissioning
The S-1 says Project Red, a pilot of about 3 MW gross, has not shown premature thermal decline. Cape has no comparable multi-year record. The next checks are the January 2027 commissioning of blocks two and three, whether Fervo discloses producer count, flow per producer and metered net output, and field data from the five EGS field tests the US Department of Energy selected on 21 September 2026, which are due to be published in its Geothermal Data Repository. The offtake side of the sector is covered in ENB’s analysis of Google’s nearly 1 gigawatt geothermal bet.
Add EnergyNews.biz as a preferred source on Google


