




A study that puts the annual value added of one Irish 30 MW wind hydrogen project at €71.2 million or €81.3 million also lists end use prices that imply sales of only €30 million to €38.5 million for the hydrogen itself. That tension sits inside Tables 3, 4 and 5 of a new paper in the International Journal of Hydrogen Energy, and it matters because the paper’s central claim is about how much a green hydrogen project adds to an economy and who gets the jobs.
Green hydrogen at 30 MW: €71.2m or €81.3m a year
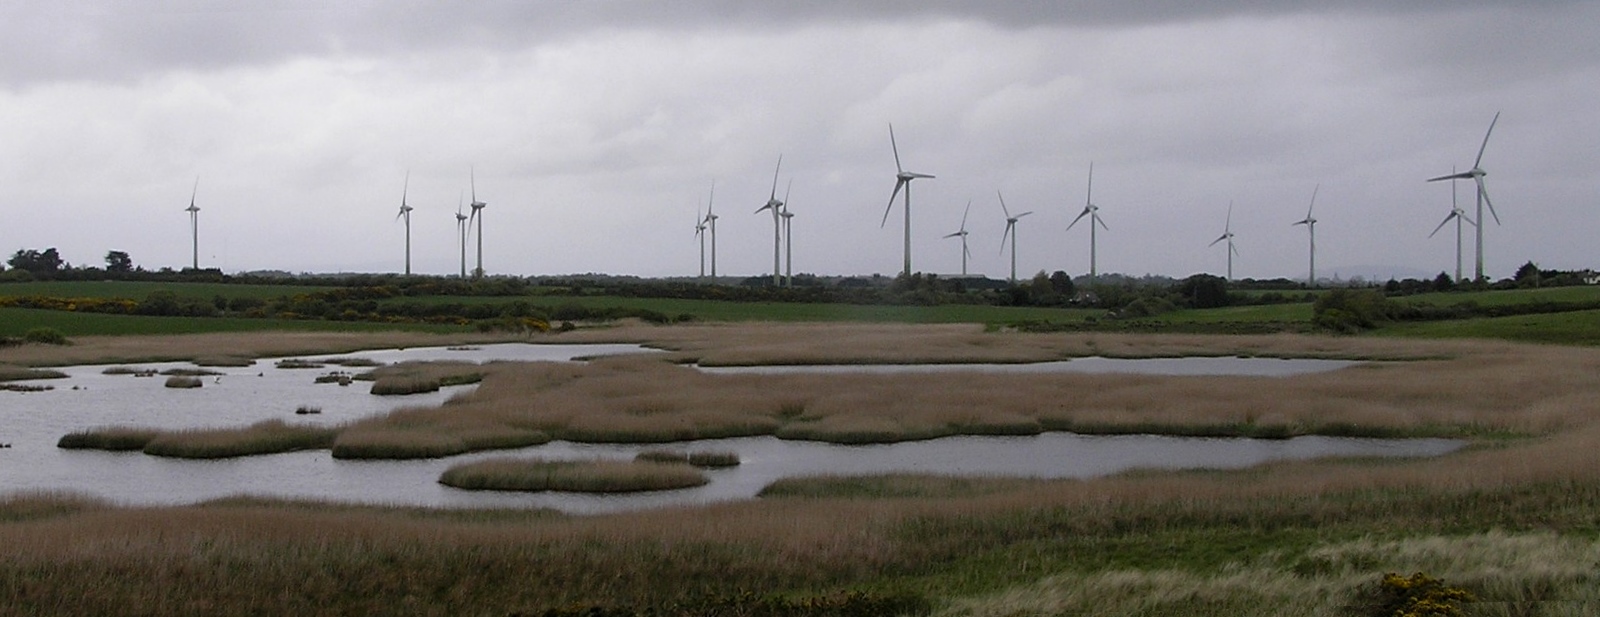
Jochelle Laguipo and James Carton adapt the IRENA socioeconomic framework to a 70 MW wind farm feeding a 30 MW electrolyser that makes 2,500 tonnes of hydrogen a year. They compare two value chains that differ only after production. Chain 1 uses compressed storage, trucking and heavy duty freight vehicles, and chain 2 uses a salt cavern, a pipeline and passenger cars. The cavern chain is a scenario for green hydrogen at scale and not a design for this project, the authors say, since caverns typically need 5,000 to 10,000 tonnes of working gas against the plant’s 2,500 tonnes a year.
For this green hydrogen project, gross value added comes out at €71.2 million for chain 1 and €81.3 million for chain 2, a gap of 14.2 percent. Employment is 855 to 872 full time equivalent years over a 2 year build and 20 years of operation, which is 28.5 FTE years per MW for the lower figure (ENB calculation) and about 39 jobs on average each year. Induced jobs, imported equipment content and decommissioning are excluded.
Where the €10m gap comes from: 84 percent sits in the end use price
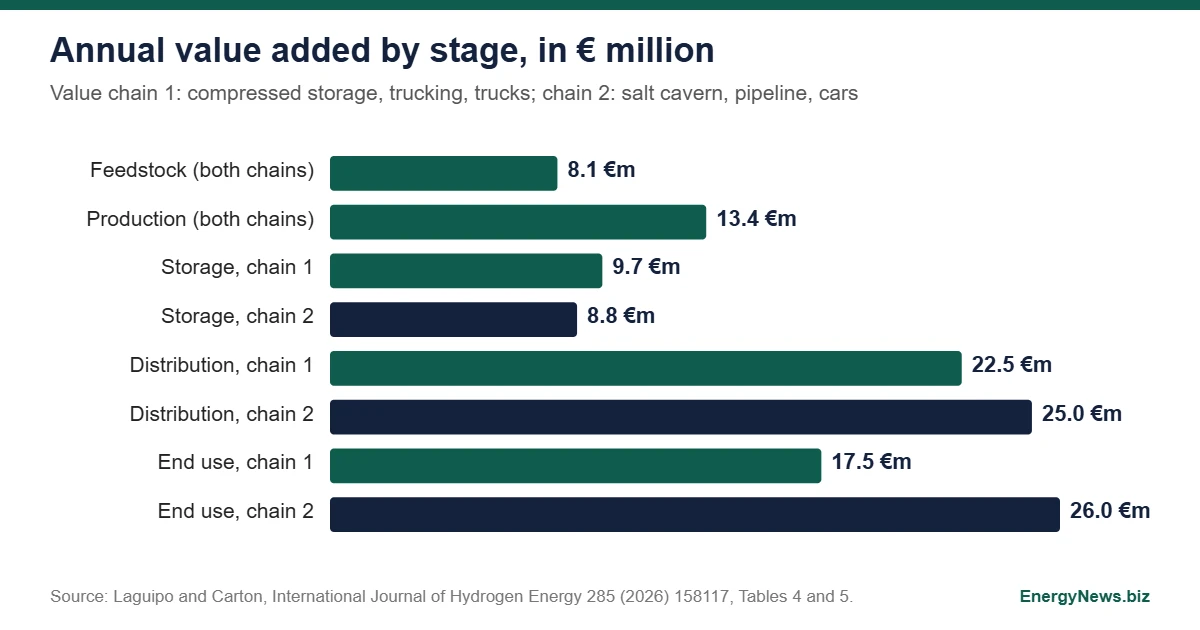
The two chains share feedstock (€8.1 million) and production (€13.4 million). Storage favours chain 1 by about €0.9 million, and distribution favours chain 2 by €2.5 million. The end use stage decides it: €26.0 million for chain 2 against €17.5 million for chain 1, a difference of €8.5 million, or 84 percent of the €10.1 million gap. The tables set that difference by an assumed selling price of €15.40 per kg for passenger car mobility against €12 per kg for freight, with the same 2.5 million kg in both, so the advantage of the pipeline chain for green hydrogen is mostly a price assumption and not a physical result.
€71.2m of value added against €30m of hydrogen sold
Value added summed across a green hydrogen chain cannot normally exceed the value of what the chain finally sells, apart from subsidies. In chain 1 the hydrogen sold at end use is 2.5 million kg at €12, or €30 million, and in chain 2 it is €38.5 million at €15.40. The reported gross value added is 2.4 and 2.1 times those sums. Adding the €31.5 million of subsidies still leaves €61.5 million and €70.0 million, below the €71.2 million and €81.3 million printed (ENB calculation). One reason is visible in the tables: each stage’s input cost is not the previous stage’s selling price. Chain 1 distribution takes an input of €2 per kg after storage sells at €7, so the intermediate purchases are not netted out as the method would require. The reading here is of the tables as printed, and the authors may have a justification not in the sections read.
Two GDP figures for each chain
The abstract gives GDP of €45.0 million to €57.0 million, which matches the tables: €44.975 million and €57.005 million. The highlights and the results text give €46.8 million and €59.0 million, and the text puts the gap at 26.3 percent. The tables give 26.7 percent. Per MW of electrolyser, gross value added is €2.37 million for chain 1 and €2.71 million for chain 2.
Jobs: 855 to 872 FTE years, and who gets them
The distribution of green hydrogen jobs is the part the authors stress. Chain 1 spreads work across dispersed end use operations, and chain 2 concentrates it in fixed infrastructure. The authors list the risks as regressive cost burdens for low income households, skills exclusion for traditional industry workers and barriers for local enterprises, but state that the distributional findings come from literature and inference and are indicative, not modelled. A sensitivity test shows the €10 million gap between chains could reverse if the hydrogen fuel price or wind electricity cost moves within the ranges tested (€6 to €10 per kg; €50 to €145 per MWh).
The decision that frames all of this is the pilot funding that Ireland may introduce from 2028, which would turn these scenarios into real choices of storage and end use. For comparable measuring of production claims against totals, see China’s green hydrogen figures set against its 39 million tonnes, and for another national plan, Hyundai’s Saemangeum hydrogen plan. Source: Laguipo and Carton, Understanding the socio-economic impacts of green hydrogen production, distribution and end-use, International Journal of Hydrogen Energy 285 (2026) 158117.
Add EnergyNews.biz as a preferred source on Google


