


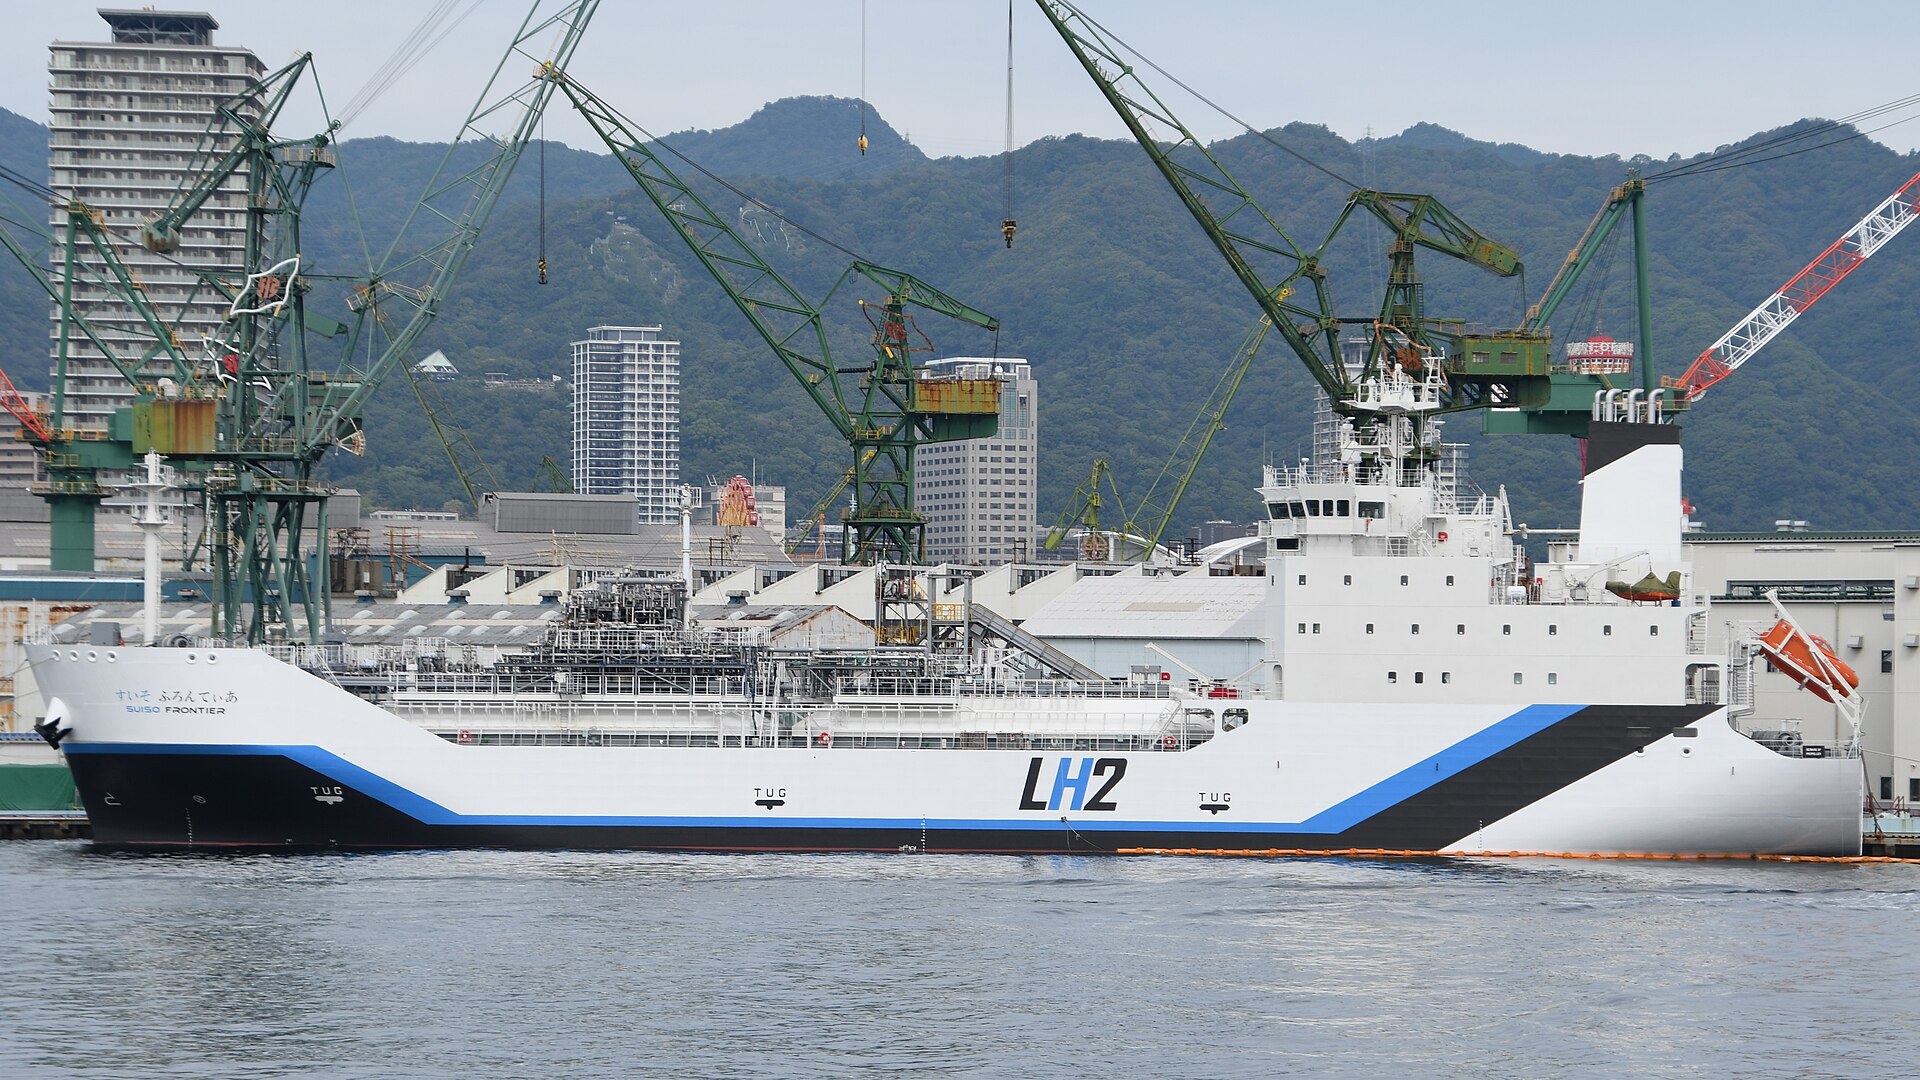


Electricity is at least 41 percent of the delivered cost of every renewable fuel in a 2030 optimisation study of five energy carriers shipped from Argentina, Australia, Algeria and Namibia, and shipping is a minor item even over 10,000 km. The study, published in the International Journal of Hydrogen Energy by Thushara Addanki, Thomas Hamacher and colleagues, tests liquid hydrogen against methanol, ammonia, synthetic Fischer-Tropsch fuel and synthetic LNG, and it does not come out as the cheapest.
The position that follows is plain. The case for liquid hydrogen as a shipped carrier cannot rest on shipping cost, because shipping is where it is weakest and electricity is where every carrier is decided. What the study leaves open is the cost after the ship, which is where the ranking may change.
Liquid hydrogen against four carriers: the setup
An hourly model, built on the open source tool urbs, sizes wind or solar generation, electrolysers, liquefaction or synthesis units, batteries, hydrogen and fuel storage, export and import terminals and the fleet, to deliver a constant 100 TWh a year of each carrier. Only the best 20 percent of sites in each country are used, three distances are tested (1,000, 5,000 and 10,000 km), and each carrier is run in 24 scenarios. The ships average 30 km/h and spend 48 hours loading and unloading, and the terminals hold 2 days of cargo at export and 20 days at import.
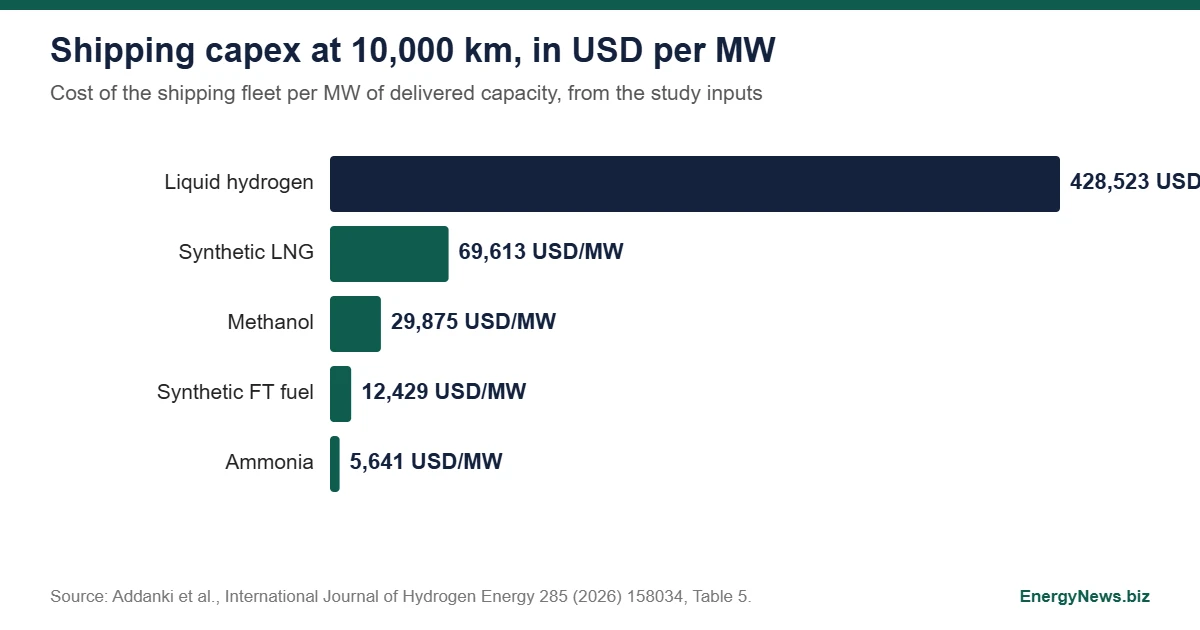
Liquid hydrogen ships cost 76 times ammonia per MW
Shipping capex at 10,000 km, taken from the study’s input table, is $428,523 per MW for liquid hydrogen, $69,613 for synthetic LNG, $29,875 for methanol, $12,429 for synthetic Fischer-Tropsch fuel and $5,641 for ammonia. The ratio to ammonia is 76, and to methanol 14. The import terminal tells the same story: $1.28 million per MW for liquid hydrogen against $157,000 for ammonia, a ratio of 8.1. The cause is volumetric energy density, plus a boil-off of 0.2 percent a day for the liquefied cargo against 0.025 percent for ammonia.
Distance matters less than the carrier. Its fleet capex rises from $91,398 per MW at 1,000 km to $428,523 at 10,000 km, a factor of 4.7 for ten times the distance, because port time dominates short routes. The study concludes that transport is cheap against generation whatever the distance.
Where the 41 percent comes from
Delivered costs run from 115 to 200 USD/MWh for methanol and 180 to 310 USD/MWh for synthetic LNG, with hydrogen, ammonia and Fischer-Tropsch fuel in between. The study’s range for that carrier alone is not given in the sections read for this analysis. Conversion efficiency from electricity is 61 percent for hydrogen, the highest, and 48 percent for synthetic LNG, the lowest. Delivering 100 TWh therefore takes about 164 TWh of electricity as hydrogen and about 208 TWh as synthetic LNG, 27 percent more.
The cheapest option is wind in Argentina, at about 4,000 full load hours, followed by solar in Namibia. Wind sites need larger hydrogen and fuel storage than solar sites despite higher full load hours, because wind varies over several days. Integration matters most for solar: storage and process optimisation cut the modelled cost of PV based liquid hydrogen from about 190 to about 140 USD/MWh, or 26 percent, by raising liquefaction operation from 2,000 to about 7,500 hours a year. Batteries stay one to two orders of magnitude smaller than hydrogen and fuel storage.
The cost after the ship
Two items sit outside the study: conversion back to hydrogen at the destination, and distribution to users. Methanol steam reforming is about 90 percent efficient and ammonia cracking about 79 percent, according to the paper. At 90 percent, methanol at 115 USD/MWh becomes about 128 USD per MWh of hydrogen before any reforming capex. At 79 percent, ammonia costs 27 percent more per MWh of hydrogen than its delivered price. Hydrogen delivered as a liquid needs no conversion, so for a buyer who wants hydrogen the ranking can reverse, while for a buyer of fuel for ships or aircraft it does not. That is the authors’ own conclusion: the carrier should follow the end use, not the supply cost.
What would have to be true: a fleet of carriers in commercial service, which the study notes has no clear timeline, and a delivered price per MWh of hydrogen at the user’s gate with reconversion included. The check is that second number, which this study does not provide. For maritime hydrogen already in order books, see PowerCell’s fuel cells for four hydrogen bulk carriers, and for production claims measured against totals, China’s hydrogen industry figures. Source: Addanki et al., Assessment of liquid hydrogen and derivatives for international maritime energy transport, International Journal of Hydrogen Energy 285 (2026) 158034.
Add EnergyNews.biz as a preferred source on Google


