





Proactive battery control only pays when the controller knows how far ahead to trust the market. A study in the Journal of Energy Storage (DOI 10.1016/j.est.2026.125289) by Shakil Mirza, Rahul Sharma, Tapan Saha and John Atherton shows that making the look ahead window dynamic lifts battery revenue by 9.23% across a full year compared with a fixed preview, while using less computation. The paper is open access, and this article is based on its full text, including the conclusion.
Why a fixed look ahead fails in the NEM
Australia’s National Electricity Market settles at 5 minute dispatch intervals, while the market operator publishes 30 minute pre-dispatch forecasts up to 48 hours ahead. The authors point out that these forecasts are biased by horizon: the further out the price, the more optimistic and the less reliable it is. A controller that optimises against a long, fixed window therefore schedules discharge too early, and then misses the realised peak. Earlier work cited in the paper reports revenue losses of up to 50% in the NEM from this kind of forecast error.
The pressure is rising. Negative price intervals grew from 0.34% of dispatch intervals in FY2018 to 14% in FY2024, and in the 2023 to 2024 spring season they reached 26% of interval hours. Rooftop solar supplied 13% of NEM generation in the first quarter of 2024. A battery that charges at negative prices and discharges into the evening peak is exposed to exactly the forecast errors that a fixed window amplifies. That is the same market where, as earlier coverage showed, record battery discharge has coincided with falling arbitrage revenue, so a few percent of extra revenue per year matters.
How the dynamic preview controller works
The proposed design has two layers. A supervisory layer runs Bayesian online change-point detection on the adjusted pre-dispatch price every 30 minutes. When it sees a new price regime, such as an approaching peak or a negative price window, it lengthens the preview. When prices are stable, it shortens it, so that distant and uncertain forecasts carry less weight. A lower layer then runs receding horizon control every five minutes using that horizon, with time varying dynamic operating envelopes and voltage limits from a sensitivity matrix refreshed every 30 minutes.
Before the controller sees the forecast, the paper subtracts the historical median pre-dispatch error for each step. On the example sequence this cut the mean absolute error by about 8.6%. The tests used a CIGRE low-voltage feeder with real household demand and solar data, and the target asset is a community battery, which the paper defines as a front-of-the-meter unit of 100 kW to 5 MW on the distribution network.
What the proactive battery control results show
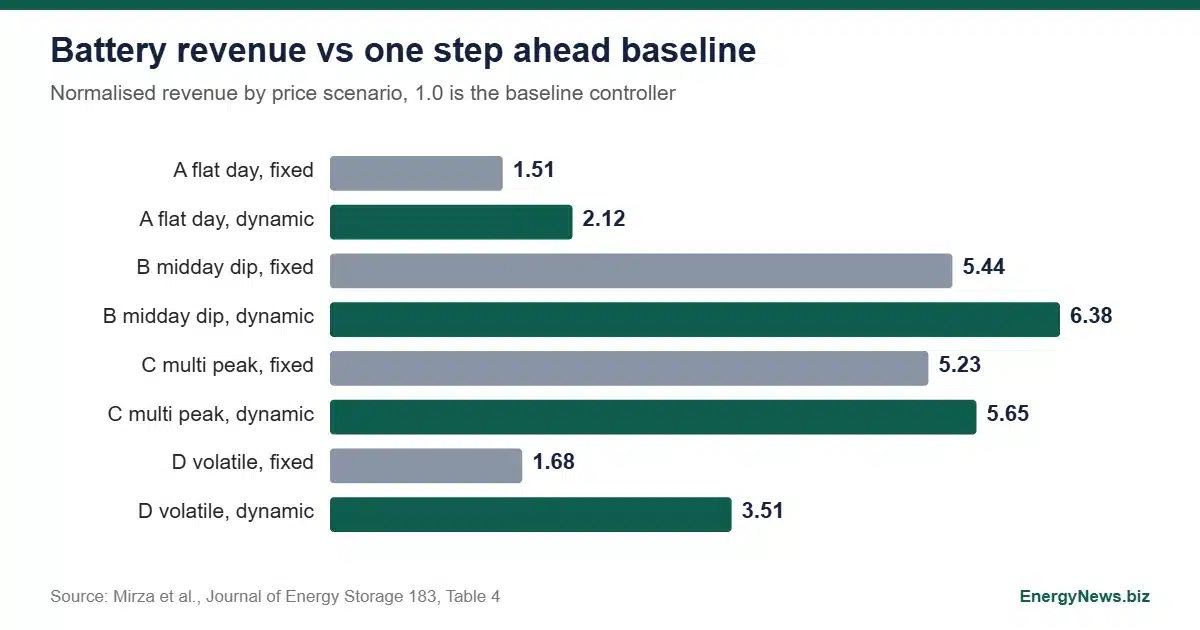
Revenue was normalised to a one sample ahead controller set at 1.0. The dynamic controller beat the fixed preview in all four representative days. On the paper’s Table 4, the dynamic to fixed revenue ratios work out to 1.40 for the flat day (2.12 against 1.51), 1.17 for the midday dip (6.38 against 5.44), 1.08 for the multi-peak day (5.65 against 5.23) and 2.09 for the highly volatile day (3.51 against 1.68). Execution time was also lower in each case, for example 1.27 against 1.54 on the volatile day.
The study also finds that longer is not better. Revenue rises with preview length up to about six hours, which is 12 half hour samples, then declines as forecast uncertainty dominates. Terminal state of charge matters too: both controllers performed best when the battery was required to end the day at 0.5, and worse at either extreme.
What to check before relying on the 9.23%
The headline 9.23% is the year-round figure and is the number to carry into planning. The single day gains above are far larger because those days were chosen to be representative of difficult price shapes, and they were drawn from 2019 market data. The work is a simulation, and the revenues are normalised rather than stated in dollars, so no absolute return can be read from it.
There is also an internal inconsistency. The text of Section 4.3 puts the fixed preview result for the flat day at 1.24, while Table 4 gives 1.51 for the same scenario. The dynamic result of 2.12 is the same in both places. The ratios above use the table. The authors also note that standard change-point detection assumes independent prices, which electricity prices violate, and they address it with an auto-regressive observation model. Their claim to be the first season-aware dynamic preview study is theirs and was not independently checked here. Market background is available from the Australian Energy Market Operator.
For operators, the practical reading is that proactive battery control should be judged by how it handles forecast uncertainty, not by how far it can see. A controller that adapts its horizon is cheaper to run and earns more, and proactive battery control of this kind could suit community batteries first, where computing budgets are small and price exposure is high. Further proactive battery control studies on live assets would show whether the simulated gain survives real forecast errors and degradation costs.
Add EnergyNews.biz as a preferred source on Google


