




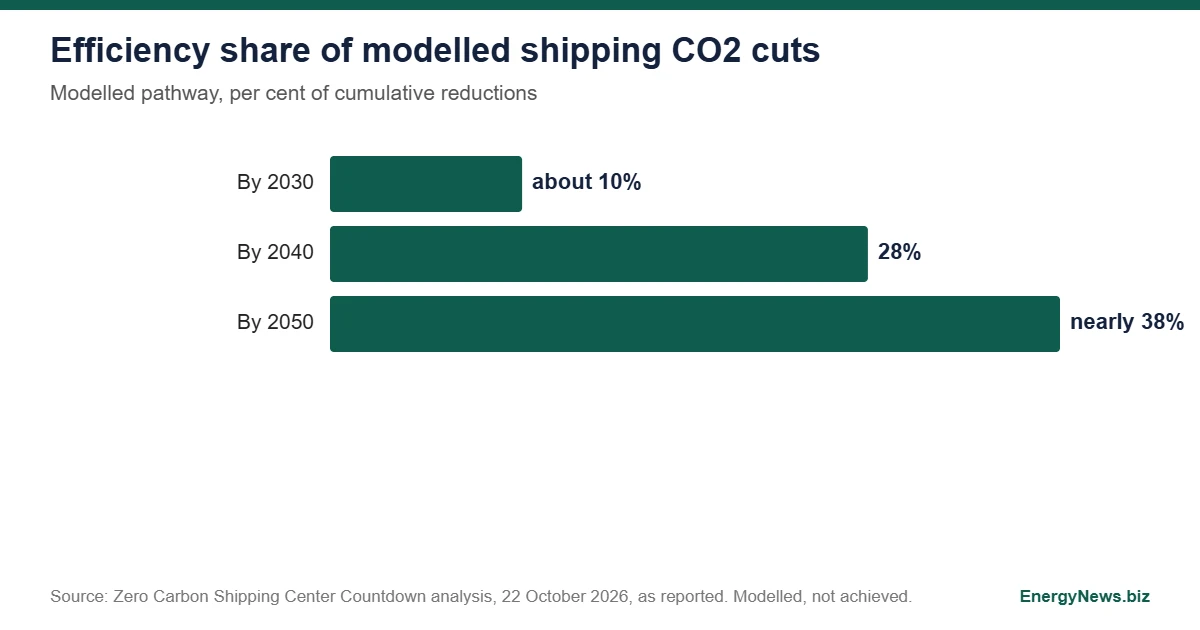
Shipping energy efficiency is modelled to deliver nearly 38% of the sector’s emissions cuts by 2050, and nobody can currently show how much of it is being delivered. That is the finding of a Countdown analysis from the Mærsk Mc-Kinney Møller Center for Zero Carbon Shipping, published on 22 October 2026. The analysis was not yet on the Center’s website when this was written, so the figures below are attributed to it as reported.
The position that follows from the numbers is plain: shipping energy efficiency is a modelled promise, not a measured result. A modelled share is a target, not a measurement, and shipping has a reporting system that records how much fuel ships burn but not which efficiency measures produced the saving. Until that changes, a large part of the decarbonisation pathway rests on savings that regulators cannot verify.
What the modelling assumes for shipping energy efficiency
Using the IMO’s Comprehensive Impact Assessment, the Center estimates that energy efficiency could contribute about 10% of modelled reductions by 2030, 28% by 2040 and nearly 38% by 2050, close to 40% of cumulative cuts through 2050. These are pathway figures. They are not reductions achieved by the existing fleet.
The shipping energy efficiency measures in scope are hull and propeller improvements, waste heat recovery, air lubrication, speed optimisation and voyage planning. Voluntary industry reporting shows hull and propeller measures are the most widely reported, while waste heat recovery and air lubrication show considerably lower uptake. Two single measures illustrate the size of the prize: just in time arrivals could cut annual shipping CO2 by 10% to 11%, and improved antifouling could save up to 19% of annual greenhouse gas emissions. Adding them gives 29% to 30%, which the Center says is not valid because the measures are not directly additive.
Where the shipping energy efficiency data gap sits in the IMO system
The reporting system is not empty. The IMO Ship Energy Efficiency Management Plan has applied to all ships since 2013 and its second part covers fuel consumption data collection and reporting. The Carbon Intensity Indicator rates ships from A to E each year, and ships rated D for three consecutive years, or E for one year, must adopt corrective plans, according to the Center’s primer on the IMO Energy Efficiency Framework. The design standards, EEDI for new ships since 2013 and EEXI for existing ships since 2023, work at the level of the ship’s design.
What none of these instruments does consistently, the Center says, is record which efficiency technologies are installed, which are used, and whether they work as intended. Fuel consumption is measured. The cause of a change in fuel consumption is not.
Why verification is hard, and what is proposed
Weather, speed, cargo and sea conditions all move fuel use, so an owner cannot read a saving off a single voyage. A second barrier is commercial: where a shipowner pays for an installation and the charterer collects the fuel saving, the incentive to install is split. Measures such as just in time arrival also depend on coordination with ports.
The Center recommends strengthening the SEEMP so that it records installed and used technologies and operational measures, and considering a central database of efficiency measure uptake. It points to the IMO’s ongoing Phase 2 review of its Energy Efficiency Framework as the moment to make the change. These are recommendations, not adopted IMO requirements.
The test for the 38% shipping energy efficiency figure is simple: a database that shows, for a named fleet, which measures were fitted and what fuel they saved. The Phase 2 review is the next dated opportunity to require one. For the fuel side of the same decarbonisation pathway, see the delivered cost of hydrogen based shipping fuels.
Add EnergyNews.biz as a preferred source on Google


