




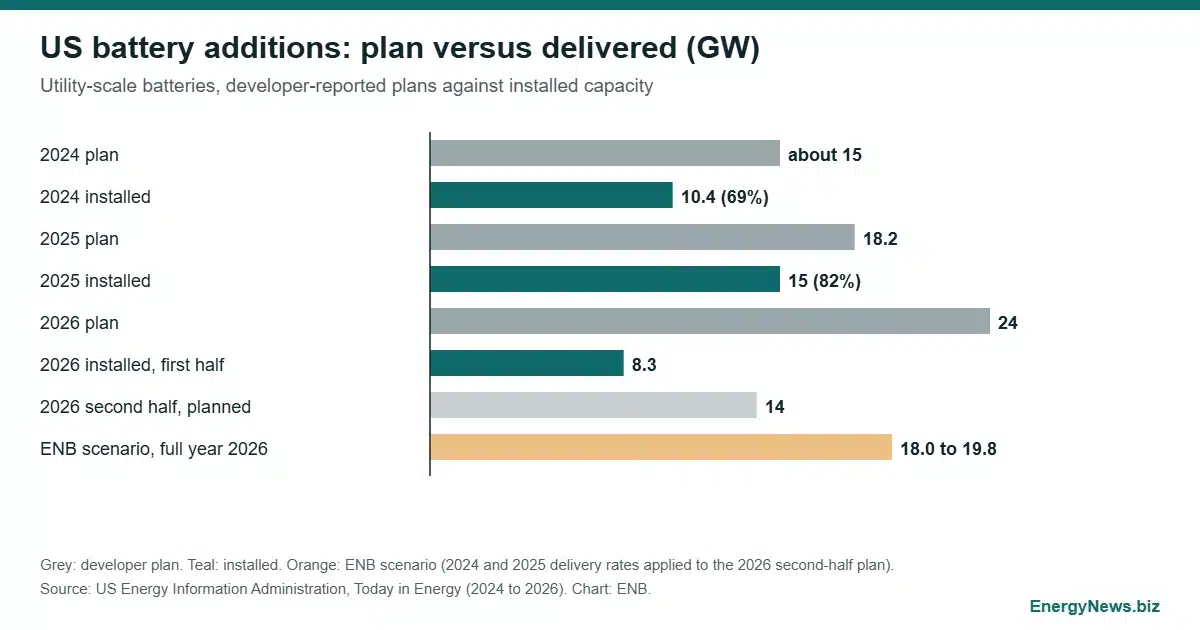
US developers told EIA they would add about 15 GW of utility-scale batteries in 2024 and 18.2 GW in 2025. The grid received 10.4 GW and 15 GW. That is a delivery rate of 69 and 82 percent. The 2026 plan of 24 GW now depends on a second half that must deliver roughly 50 percent more than the second half of 2025, and the same developer-reported pipeline underpins the 54 GW EIA lists through mid-2028. For anyone pricing storage supply or grid adequacy, the delivery rate matters more than the headline plan.
Planned versus installed battery capacity
EIA publishes the plan each winter and the outcome a year later, so the comparison needs no estimate. Plans come from the generator inventory that operators report to the agency.
| Year | Plan stated early in year (GW) | Added (GW) | Delivery rate |
|---|---|---|---|
| 2024 | about 15 | 10.4 | 69% |
| 2025 | 18.2 to 19.6 | 15 | 77% to 82% |
| 2026 | 24 | 8.3 in H1; 14 planned for H2 | open |
The 2025 range reflects two EIA figures from early 2025, 19.6 GW from the January inventory and 18.2 GW published a month later. Outturn fell short of early-year plans by 18 to 31 percent. EIA labels its 2026 stock figure as nameplate, while the plan figures and the earlier texts state no basis, so treat year-to-year comparisons as approximate.
2026 first half: 8.3 GW installed
EIA puts operational capacity at 43.6 GW at the end of 2025 and at nearly 52 GW nameplate after 8.3 GW were added in the first half of 2026. That is 35 percent of the 24 GW plan, in line with a back-loaded year. The agency’s own half-year plan has already slipped: 8.3 GW installed plus 14 GW planned gives 22.3 GW, which is 1.7 GW below the February figure.
The second half 2025 outturn can be backed out roughly: the 15 GW annual figure minus the 5.9 GW EIA recorded for the first half leaves about 9.1 GW. Delivering 14 GW would require 54 percent more. Monthly, the first half ran at about 1.4 GW; the second-half plan needs 2.3 GW, a pace 69 percent higher.
Applying the 2024 and 2025 delivery rates (69 to 82 percent) to the 14 GW gives 9.7 to 11.5 GW, or 18.0 to 19.8 GW for the year.
Texas as an independent check
EIA’s February outlook assigned 12.9 GW of the 24 GW, or 53 percent, to Texas. ERCOT’s own monthly resource adequacy outlooks give a second view. The December 2025 outlook listed 14,735 MW of installed battery capacity; the November 2026 outlook lists 20,966 MW. That is a gain of 6.2 GW over eleven months, about 48 percent of the Texas plan.
The two series are not like for like. ERCOT rates units at the sustained output specified by the manufacturer, EIA reports fleet capacity as nameplate, and the December 2025 number was itself a forecast made in October 2025. Even so, the direction is clear. If Texas adds 6.2 GW instead of 12.9 GW and every other state delivers its plan, the national total is 24 minus 6.7, or 17.3 GW. That sits just below the range from historical delivery rates, so two routes point to roughly 17 to 20 GW, not 24. The money side of that gap is covered in ENB’s earlier analysis of merchant ERCOT battery revenue.
Installed capacity is not available capacity
The same ERCOT reports show how little of the fleet is counted on at the risk hour. For November 2026 the outlook shows 7,854 MW of expected available battery capacity against 20,966 MW installed, 37 percent, at the evening hour with the highest shortage risk. For August 2026 the figures are 4,619 MW against 20,319 MW, 23 percent, and for December 2025 they were 4,348 MW against 14,735 MW, 30 percent. The hours differ, but the pattern holds: state of charge and seasonal ratings, not the installed rating, set what the fleet contributes to adequacy. ERCOT’s stress case fixes availability at 4,394 MW for November, reflecting a very low state of charge.
A stock check that does not close
EIA reported cumulative capacity above 26 GW at the end of 2024. Adding the 15 GW recorded for 2025 gives just over 41 GW, yet EIA states 43.6 GW at the end of 2025. The gap of up to 2.6 GW is not explained in the articles; revisions, reclassification or a different basis are the likely causes. Analysts using these series for annual flows should reconcile them before drawing growth rates.
EIA’s next Preliminary Monthly Electric Generator Inventory is due on 23 October 2026 and will show whether September additions moved toward the 2.3 GW monthly pace the plan requires; ERCOT’s next monthly outlook will show whether the Texas fleet follows its 21 GW path.
Add EnergyNews.biz as a preferred source on Google


