




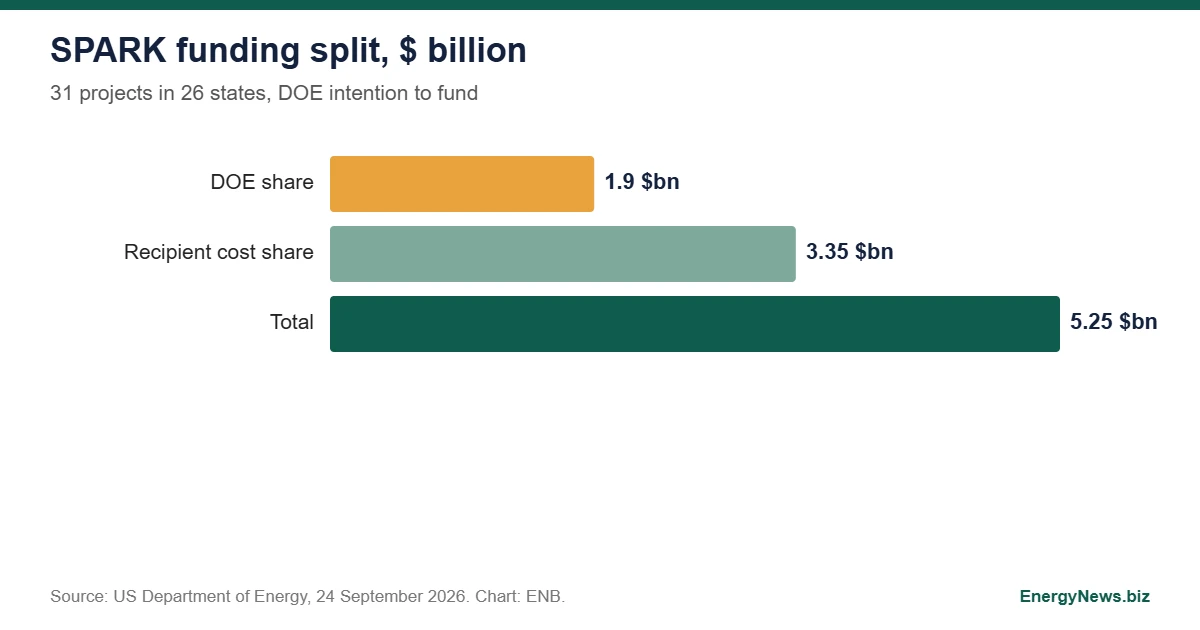
The US Department of Energy’s Office of Electricity said on 24 September 2026 that it intends to fund 31 transmission projects in 26 states under its SPARK initiative, with a total of $5.25 billion: $1.9 billion from DOE and $3.35 billion from recipients. DOE says the projects would unlock more than 20 GW of additional grid capacity through reconductoring and advanced transmission technologies. On those figures ENB calculates about $262 per kW of added capacity, all in. DOE’s announcement is an intention to fund, not a signed award.
What reconductoring is
Reconductoring replaces the wires on existing towers with conductors that carry more current, often at higher operating temperatures with less sag. It reuses the right of way, which is the slowest part of building new lines, and it is why DOE pairs it with advanced transmission technologies that raise the usable capacity of a line without new corridors.
The funding arithmetic
| Metric | Value | Basis |
|---|---|---|
| Projects | 31 in 26 states | DOE |
| Total investment | $5.25 billion | DOE |
| DOE share | $1.9 billion | DOE |
| Recipient cost share | $3.35 billion | DOE |
| Federal share of total | 36% | ENB: 1.9 divided by 5.25 |
| Recipient dollars per DOE dollar | about 1.76 | ENB: 3.35 divided by 1.9 |
| Average total per project | about $169 million | ENB: 5.25 billion divided by 31 |
| Average DOE share per project | about $61 million | ENB: 1.9 billion divided by 31 |
| Cost per kW of added capacity | about $262 (DOE share about $95) | ENB: divided by 20 GW |
How to read $262 per kW
The figure is an upper bound, because DOE says the projects would unlock more than 20 GW, so the cost per kW would be lower if the capacity delivered is higher. It is also a different thing from the cost of generation. The capacity is transfer capability on lines, which lets power move from where it is made to where it is used. For a sense of scale, 20 GW is about three times the 6.8 GW gap that ENB reported in the PJM backstop procurement delay. The comparison is loose: the 31 projects are spread across 26 states, and transfer capability does not replace missing supply inside one region.
Why recipients put in two thirds
Recipients provide 64% of the money, which suggests utilities and transmission owners expect the upgrades to return value through rates and avoided congestion costs. The announcement does not say how much of the cost share is regulated rate base, and that will decide who pays in the end.
What to watch
An intention to fund can change before award. The points to follow are which projects reach signed agreements, how DOE verifies the 20 GW claim after the work is built, and how quickly reconductored lines are energized compared with the timelines for new transmission. Without a published project list and per project capacity in the material ENB reviewed, the headline average is the only unit cost that can be checked today.
Add EnergyNews.biz as a preferred source on Google


